
Lam Nguyen
About Me
Lehigh University, Class of 2026
College of Business – Finance and Business Analytics

Portfolio
📈 Stock Return Survival Analysis
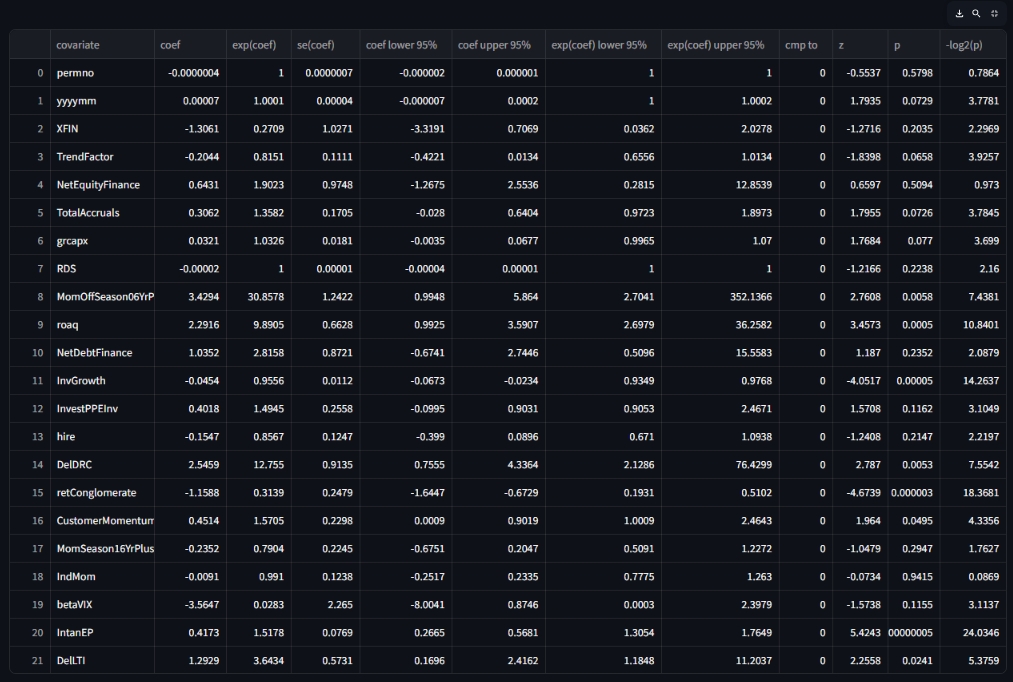
This analysis uses the Cox Proportional Hazards model to evaluate financial signals. Hazard ratios (exp(coef)) indicate how each signal affects the risk of stock delisting:
- Hazard ratio > 1 → Higher risk of being delisted (shorter survival)
- Hazard ratio < 1 → Lower risk (positive survival)
Example: Total Accruals
A ratio > 1 means higher accruals increase the chance of delisting or financial distress.
Significance is determined at p < 0.1.
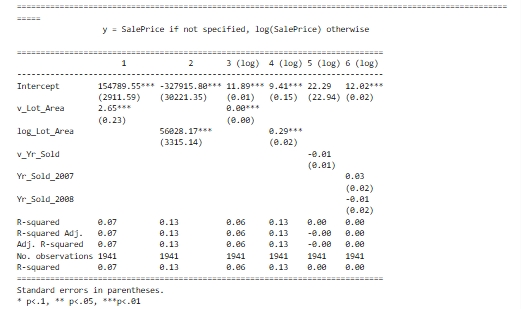
📊 Regression Practice
This was an exercise in interpreting regression outputs. The model regressed Lot Area and Year Sold on Sales Price.

🤝 Team Project: Stock Prediction Analysis
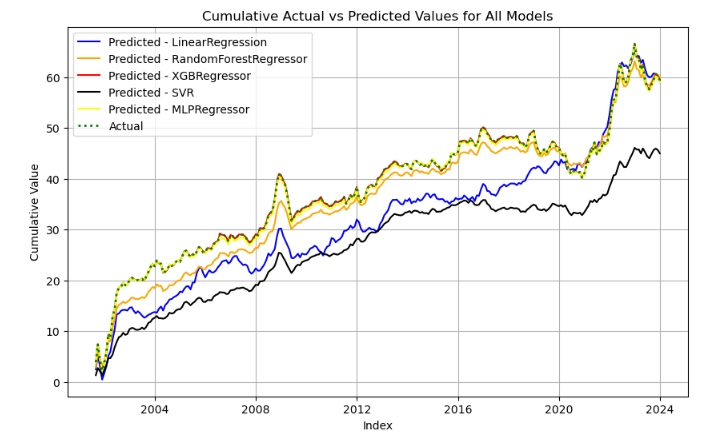
This project compares cumulative returns of signal-level portfolios using the OpenAP library and several ML models:
- Linear Regression
- MLP Regressor
- Random Forest
- SVR (Support Vector Regressor)
- XGBoost
Career Objectives
Aspiring finance and analytics professional pursuing a B.S. in Finance and Business Analytics at Lehigh University. I aim to leverage financial modeling, investment analysis, and data science to add value in private equity, venture capital, or financial consulting. Passionate about delivering data-driven insights and sustainable investment strategies on a global scale.
Hobbies
🎵 Music Production
🏋️♂️ Gym & Fitness
🏀 NBA Fan – Lifelong supporter of the Golden State Warriors
📬 Contact
- Email: ngoclamnguyenpham@gmail.com
- Phone: (484) 767-0534
- Location: Bethlehem, PA